Hudl Statsbomb

Advanced Football Analytics. Verified by Video. One Unified Platform.

Hudl Statsbomb provides the actionable insights you need, linked to video, for faster smarter decisions across player recruitment, opposition scouting and match analysis.

A composition of two screens, a laptop and a larger monitor, displaying sports analytics data. The laptop in the foreground shows a dashboard with various charts and graphs, including radar charts, bar graphs with red and green segments, and a fan-shaped graph. The larger monitor in the background displays a different interface, focused on "Pitch vis & table" with a scatter plot of colorful dots, representing player positions or actions on a field. A video player section on the right of the monitor shows a still from a soccer game, and below it, a list of events related to the game. Both screens showcase detailed visual data related to sports performance analysis.

Hudl Statsbomb is the most advanced and innovative analysis solution on the market.

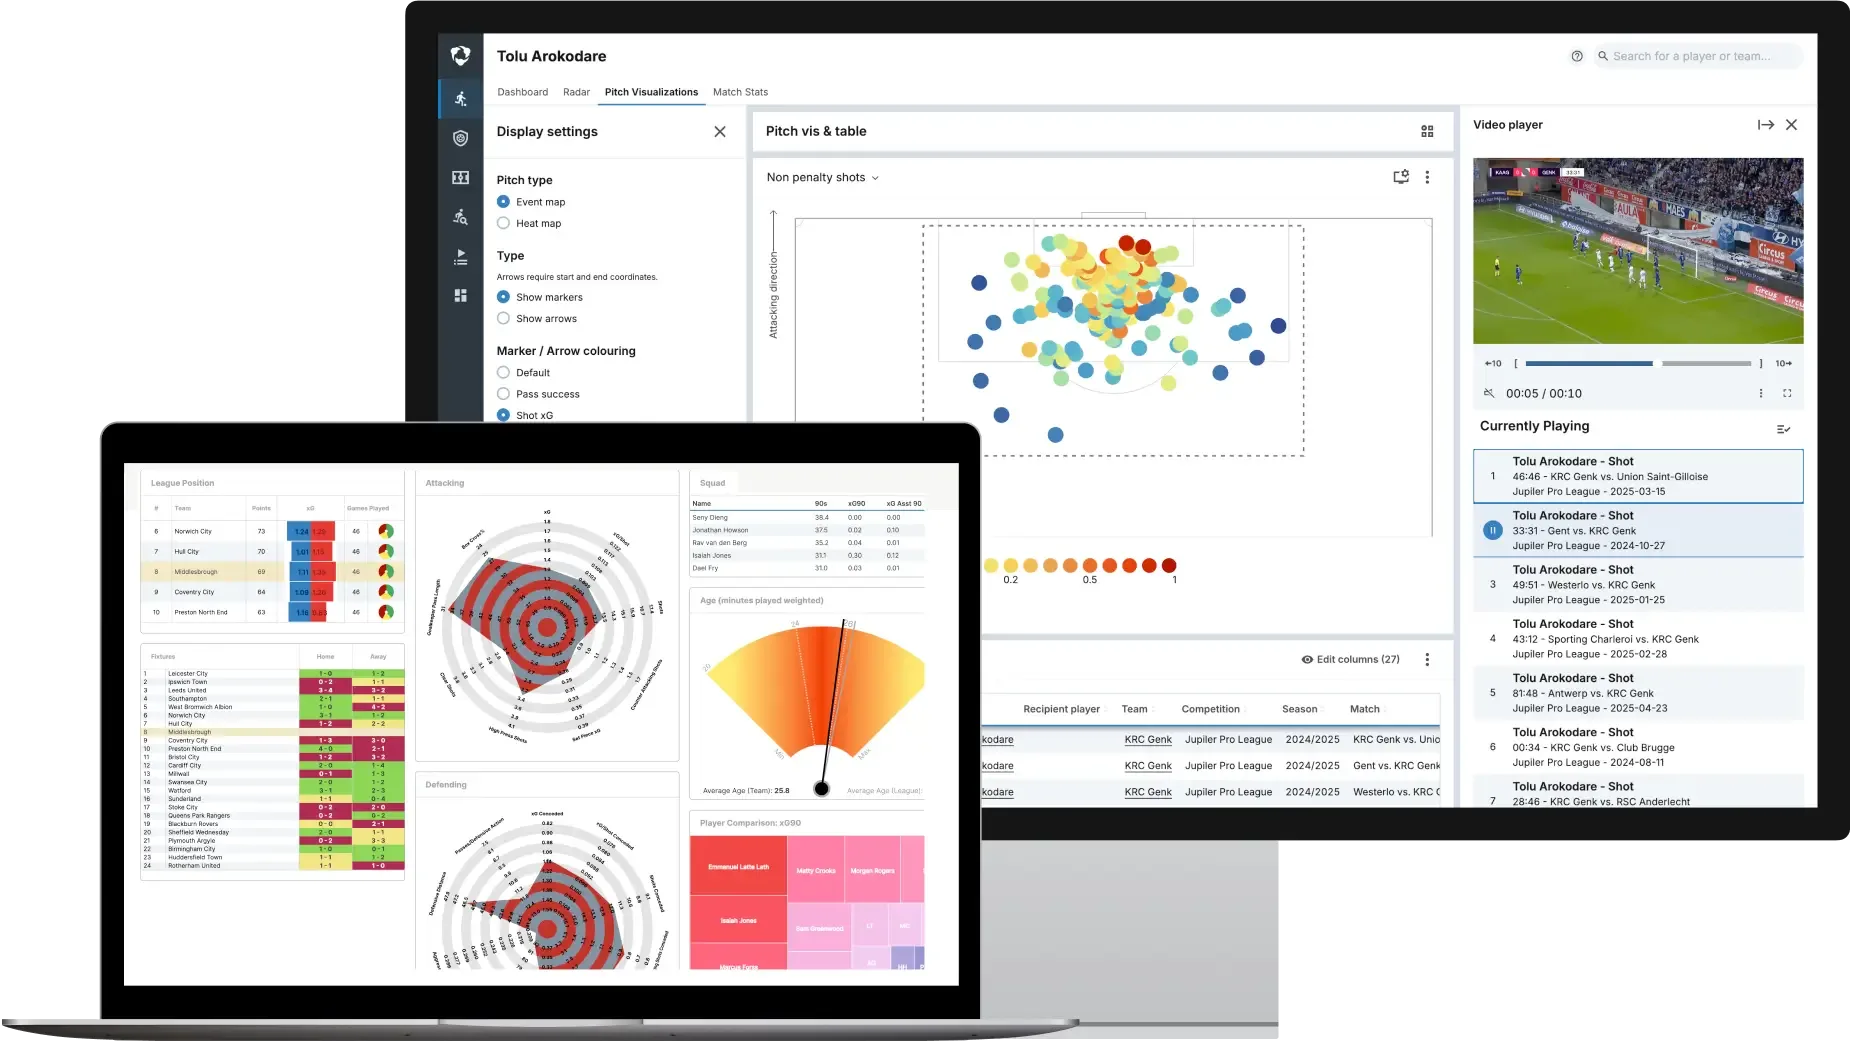
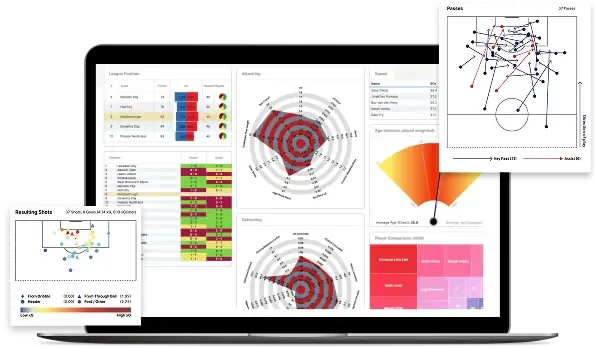
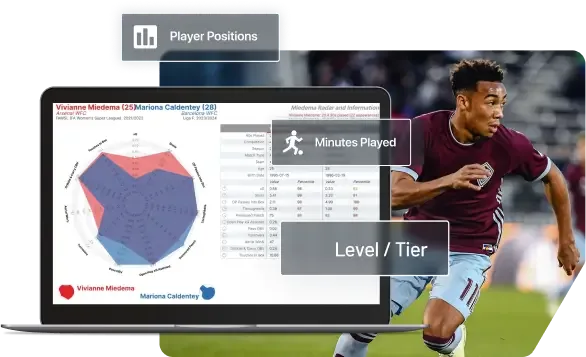
Unifying industry-leading data with football’s most extensive video library, to bring to life the insight behind every shot, move, and pass. Easy-to-use, intuitive visualisations instantly linked to relevant clips–all on one platform and only possible with Hudl.

Unmatched Analytical Depth

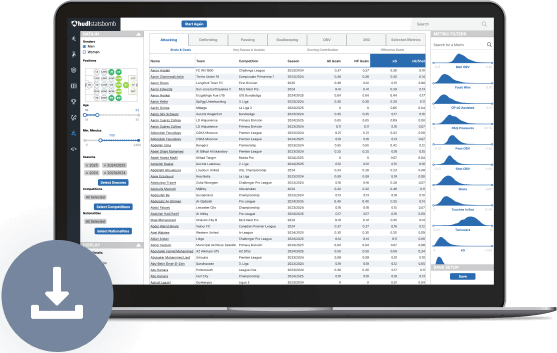
Access the most comprehensive performance data available, giving you insights no other football analytics platform can match.

Accelerate Analysis

Save significant time by using Hudl Statsbomb to surface unique performance insights from customisable visualisations and filters within seconds.

Support Smarter Decisions

Equip your analysts and scouts with more flexible comparison tools to comprehensively evaluate opponents and players, enabling informed data-driven decision-making.

Crucial Video Context

Combine world-class data and visualisation tools with integrated video playlists—allowing you to put data insights into context with just a click.

A dynamic collage of multiple digital screens displaying various sports analytics interfaces. The screens are arranged at different angles, creating a sense of depth. Each screen shows detailed data visualizations, including: a soccer field with player movements and passes (light blue lines), heatmaps indicating activity zones, radar charts with red segments, and grids of circular icons. Several screens also feature video players showing stills from soccer matches, accompanied by timelines and lists of events.
A New Era

Integrated Wyscout Video

Streamline your recruitment analysis by directly linking video evidence to analytics — without leaving the Hudl Statsbomb platform. Reduce toggling between systems, increase decision confidence, and improve overall efficiency.

  • Data insights side-by-side with quality footage
  • Validate analysis with additional context
  • Designed by analysts, for analysts
A man is seated facing away from the viewer, looking at a large screen displaying a sports match. He is wearing a grey top with a red hood. In the foreground and left, several digital interfaces are overlaid, suggesting a connection between the live action and data analysis. These interfaces show various sports analytics, including: a dashboard with charts, a radar graph, a heatmap, and a scatter plot of data points. Another interface displays a table of statistics alongside a video player showing a sports game with a timeline and event list below it.
Recruitment

Scouting, Simplified

Navigate the global game with ease — choose from 170+ leagues, apply detailed metric filters, and instantly build role-specific player shortlists. 

Flexible tools

Your Workflows, Your Way

A wide shot of a laptop screen displaying a comprehensive sports analytics dashboard. The dashboard is filled with various charts and graphs, including: league positions, fitness metrics, radar charts, a fan-shaped graph, and a list of players. Overlaid on the main screen are two smaller pop-up windows. One shows a soccer field with lines and dots representing player movements and passes. The other, positioned in the bottom left, is also a soccer field diagram with various colored dots and lines, indicating different types of shots or actions.

Personalise Your Analysis

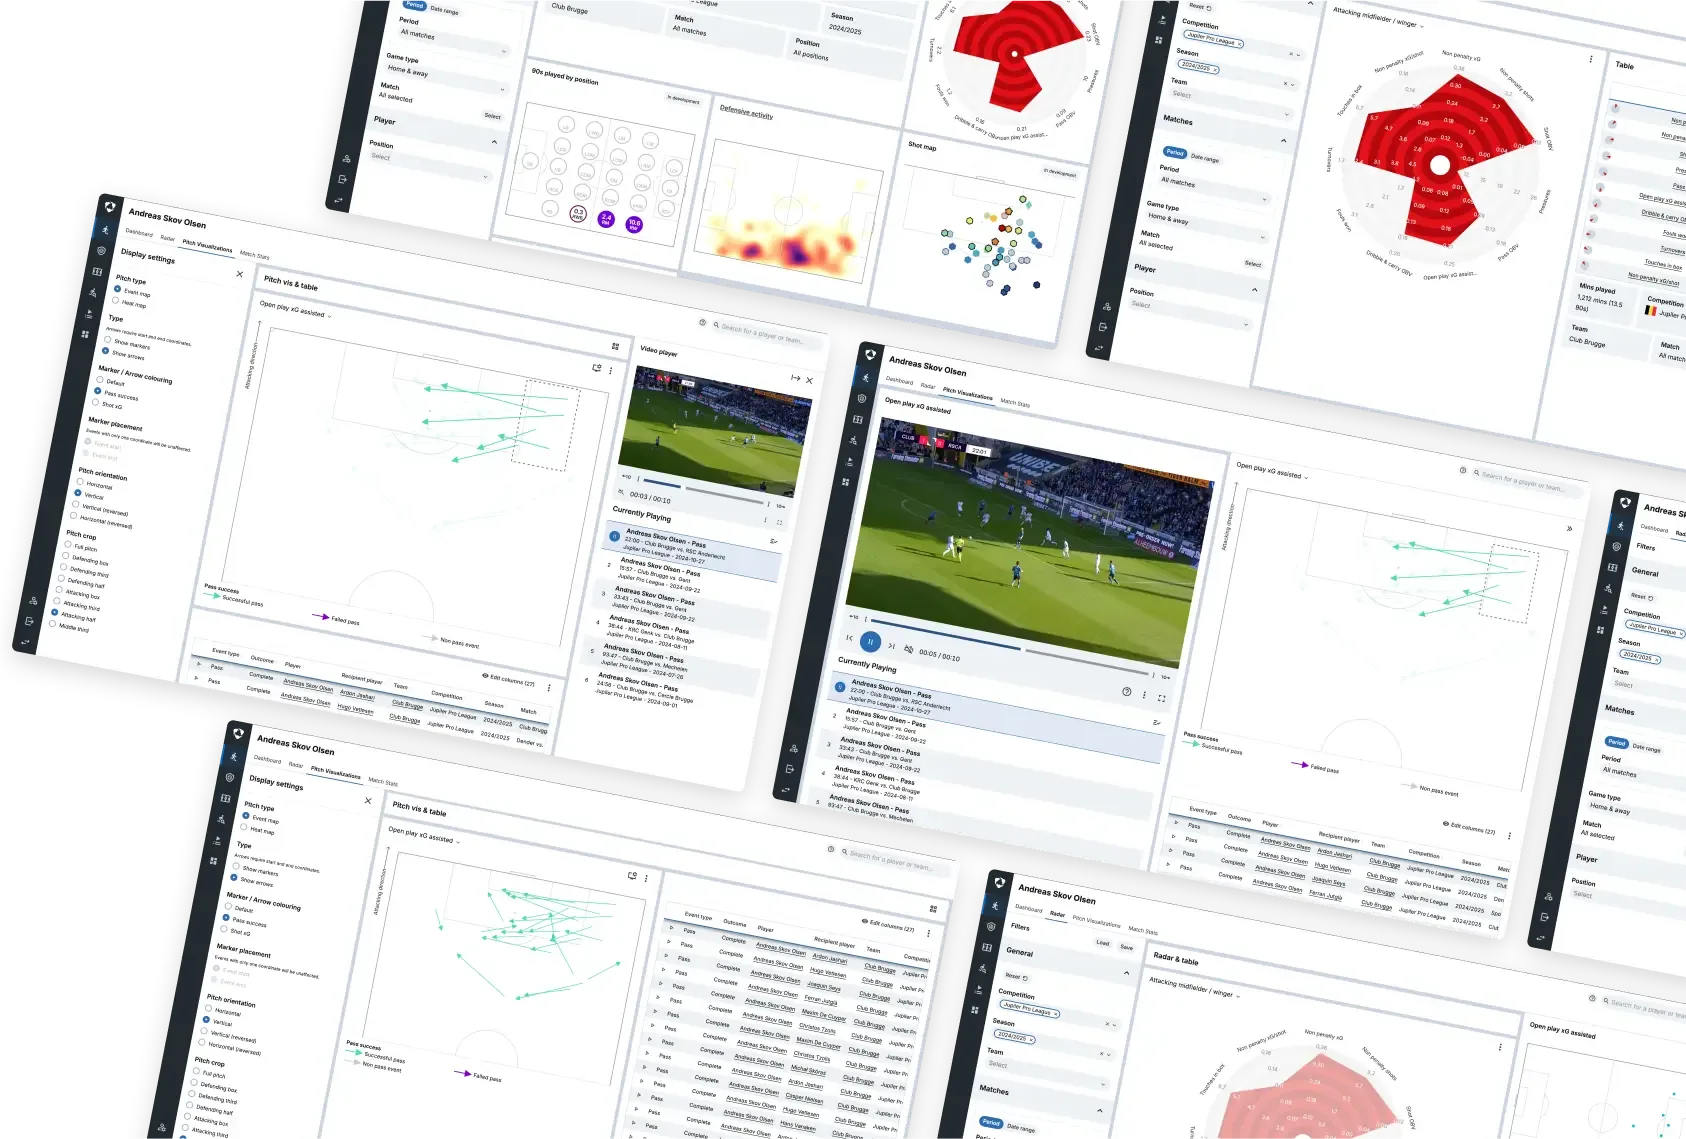
Customise the metrics displayed in your data visualisations—including Hudl Statsbomb’s iconic radars—to suit your needs.

A laptop screen displaying a detailed sports data analysis interface. The main part of the screen shows a table of player statistics under tabs like "Attacking," "Defending," "Passing," and "Goalkeeping." On the left side, there's a sidebar with various filters for age, minutes played, and season. On the right side, a "METRIC FILTERS" section shows a list of metrics with small graphs next to each, resembling probability distributions or performance indicators. A large blue circular download icon is overlaid on the bottom left corner of the laptop.

Save and Reuse Templates

Create and store custom templates for use across multiple features such as comparison tables, player searches, and more.

A composition featuring a laptop screen displaying soccer player analytics and a vibrant image of a male soccer player in action. The laptop screen shows a detailed player comparison with a large red and blue radar chart at its center, surrounded by various statistical data. Overlaid on the image are three transparent, dark grey boxes with white text and icons: "Player Positions" with a bar chart icon, "Minutes Played" with a running player icon, and "Level / Tier." The soccer player on the right wears a burgundy and light blue jersey and is captured mid-stride during a game.

Narrow Your Search with Precision

Use more flexible filters than ever before to visualise and report on specific event types, timeframes within matches, and date ranges—across players, teams, seasons, and leagues.

Actionable Team Analysis Insights

Explore 160+ insight metrics–including shots, corners, passing, set pieces–to run extensive opposition analysis and gain a winning edge. Evaluate set-piece design, positioning, passing networks, pressure, and more.

Break Down Tactics with Ease

With Hudl Statsbomb’s Tactics module, unlock tactical insights instantly—customise every detail from pitch zones to xG, and quickly reveal team and player strengths, weaknesses, and game-changing patterns.

Player Evaluation Perfected

Accurately assess talent with exclusive metrics like On-Ball Value (OBV), integrated with match footage to give you the complete picture. Uncover potential others miss, quantify performance beyond basic stats, and verify insights visually.

Endorsed by Experts

“Hudl Statsbomb’s solutions have had a great impact on our work. They are crucial in the process of providing important insights to the decision makers at the club.”
Clube Atlético Mineiro crest logo

Atlético Mineiro

Ready to get started?

Fill out this form to get in touch with our sales team.